
계절성을 고려한 예측
주요 개념
- 계절성 단순 예측과 계절성 평균 예측
sp: 계절성 주기- 표류와 계절 패턴의 결합
실습 준비
pip install sktime
import pandas as pd
from sktime.forecasting.naive import NaiveForecaster
실습 프롬프트
🤖 AI 프롬프트
beer.xlsx의 맥주 생산량을 sktime으로 2015년 2분기까지 예측해줘.
같은 분기의 마지막 값과 과거 평균으로 계절성을 반영하고, 표류 추세도 결합한 예측을 그래프로 비교해줘.
데이터와 예측 날짜 준비
beer.xlsx: 분기 시작일(quarter)별 맥주 생산량(production)- 마지막 관측 분기 다음부터 20개 분기, 즉 5년을 예측
beer = pd.read_excel('beer.xlsx', parse_dates=True, index_col='quarter')
start_date = beer.index[-1] + pd.offsets.QuarterBegin(startingMonth=1)  # 다음 달력 분기초
future_dates = pd.date_range(start=start_date, periods=20, freq='QS')
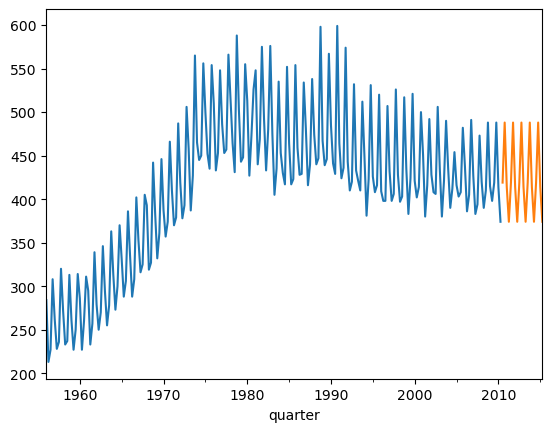
마지막 값과 계절성
- 마지막 동일 계절의 관측값을 예측에 사용
sp=4: 분기별 자료의 계절성 주기는 4분기- 분기 기간 인덱스: 날짜 대신
2010Q3처럼 해당 분기를 표현 - 훈련 자료와 예측 시점을 분기 기간 인덱스로 변환
yp = beer.production.copy()
yp.index = beer.index.to_period('Q')
future_periods = future_dates.to_period('Q')
fc_last_season = NaiveForecaster(strategy='last', sp=4)  # 4분기 주기
fc_last_season.fit(yp)
y_pred_ls = fc_last_season.predict(fh=future_periods)
pred_ls = pd.DataFrame({'production': y_pred_ls}, index=future_periods)
pred_ls.head()
실행 결과
        production
2010Q3       419.0
2010Q4       488.0
2011Q1       414.0
2011Q2       374.0
2011Q3       419.0
beer.production.plot()
pred_ls.production.plot()
실행 결과
<Axes: xlabel='quarter'>
<Figure size 640x480 with 1 Axes>
평균과 계절성
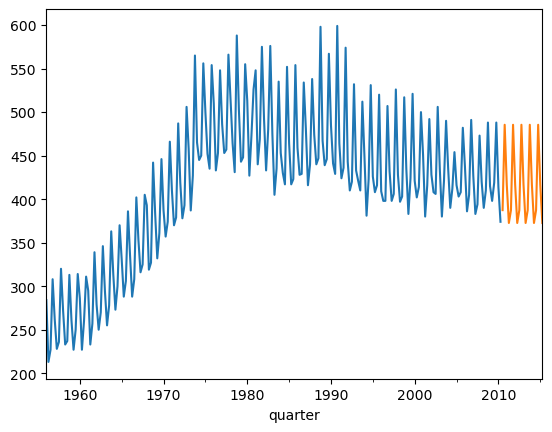
- 과거의 동일 분기 관측값을 평균하여 해당 분기의 예측값으로 사용
- 앞서 변환한
yp와future_periods를 사용
fc_mean_season = NaiveForecaster(strategy='mean', sp=4)  # 분기별 평균
fc_mean_season.fit(yp)
y_pred_ms = fc_mean_season.predict(fh=future_periods)
pred_ms = pd.DataFrame({'production': y_pred_ms}, index=future_periods)
pred_ms.head()
실행 결과
        production
2010Q3  387.370370
2010Q4  485.444444
2011Q1  416.818182
2011Q2  372.618182
2011Q3  387.370370
beer.production.plot()
pred_ms.production.plot()
실행 결과
<Axes: xlabel='quarter'>
<Figure size 640x480 with 1 Axes>
표류와 계절성
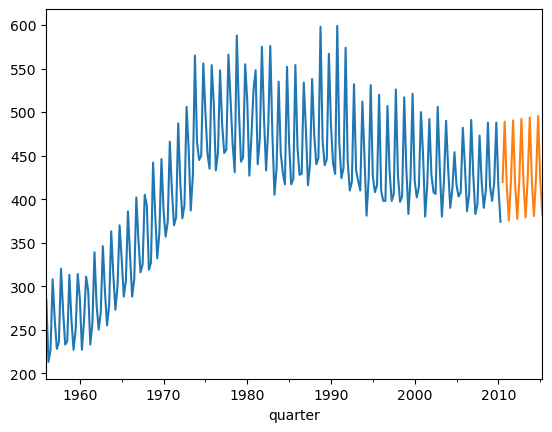
strategy='drift'는sp를 지정해도 계절성을 직접 반영하지 않음- 계절성 단순 예측에 표류의 누적 변화량을 더하는 방식으로 직접 결합
- 표류 예측에서 마지막 관측값을 빼면 미래까지의 누적 변화량만 남음
- 그 변화량을 각 분기의 계절성 단순 예측값에 더함
fc_drift = NaiveForecaster(strategy='drift')
fc_drift.fit(beer.production)
y_pred_drift = fc_drift.predict(fh=future_dates)

seasonal = y_pred_ls.copy()
seasonal.index = y_pred_drift.index  # 분기 기간 인덱스를 예측 날짜와 맞춤
y_pred_ds = seasonal + (y_pred_drift - beer.production.iloc[-1])  # 계절별 수준에 표류 변화량 추가
pred_ds = pd.DataFrame({'production': y_pred_ds}, index=future_dates)
pred_ds.head()
실행 결과
            production
2010-07-01  419.414747
2010-10-01  488.829493
2011-01-01  415.244240
2011-04-01  375.658986
2011-07-01  421.073733
beer.production.plot()
pred_ds.production.plot()
실행 결과
<Axes: xlabel='quarter'>
<Figure size 640x480 with 1 Axes>
퀴즈
분기별 자료에 sp=4를 적용한 계절성 예측에 대한 올바른 설명을 모두 고르세요.
퀴즈를 풀려면 대화형 기능을 불러와야 합니다.