
단순 시계열 예측
주요 개념
sktime- 마지막 값·평균·표류를 이용한 예측
- 최근 관측 구간의 길이 조절
실습 프롬프트
🤖 AI 프롬프트
beer.xlsx의 맥주 생산량을 sktime의 마지막 값·평균·표류 방법으로 2015년 2분기까지 예측해줘.
전체 과거 자료를 쓸 때와 최근 3년만 쓸 때의 평균·표류 예측을 그래프로 비교해줘.
sktime
- 시계열 머신러닝 라이브러리
NaiveForecaster: 단순한 가정에 기반한 예측 모형
pip install sktime
from sktime.forecasting.naive import NaiveForecaster
실습 데이터
quarter: 분기 시작일production: 분기별 맥주 생산량
import pandas as pd
beer = pd.read_excel('beer.xlsx', parse_dates=True, index_col='quarter')
y = beer.production
beer.head()
실행 결과
            production
quarter
1956-01-01         284
1956-04-01         213
1956-07-01         227
1956-10-01         308
1957-01-01         262
예측을 위한 다음 날짜
- 마지막 관측일 확인
last_date = beer.index[-1]
last_date
실행 결과
Timestamp('2010-04-01 00:00:00')
- 이 데이터는 1·4·7·10월의 첫날에 관측
QuarterBegin(startingMonth=1): 해당 달력 분기의 다음 시작일
start_date = last_date + pd.offsets.QuarterBegin(startingMonth=1)  # 1·4·7·10월 기준
start_date
실행 결과
Timestamp('2010-07-01 00:00:00')
- 20개 분기초, 즉 5년의 예측 날짜 생성
future_dates = pd.date_range(start=start_date, periods=20, freq='QS')
future_dates
실행 결과
DatetimeIndex(['2010-07-01', '2010-10-01', '2011-01-01', '2011-04-01',
               '2011-07-01', '2011-10-01', '2012-01-01', '2012-04-01',
               '2012-07-01', '2012-10-01', '2013-01-01', '2013-04-01',
               '2013-07-01', '2013-10-01', '2014-01-01', '2014-04-01',
               '2014-07-01', '2014-10-01', '2015-01-01', '2015-04-01'],
              dtype='datetime64[ns]', freq='QS-JAN')
마지막 값으로 예측
- 모든 예측값을 마지막 관측값으로 지정
- 경제·금융 시계열 등에서 다른 모형과 비교할 단순한 기준으로 활용
- 랜덤 워크(random walk)의 증분 기대값이 0이면 미래의 기대값은 마지막 관측값
fit(): 모형 적합predict(fh=...): 지정한 예측 시점의 값 계산
fc_last = NaiveForecaster(strategy='last')  # 단순 기법
fc_last.fit(y)
y_pred_last = fc_last.predict(fh=future_dates)
pred_last = pd.DataFrame({'production': y_pred_last}, index=future_dates)
pred_last.head()
실행 결과
            production
2010-07-01       374.0
2010-10-01       374.0
2011-01-01       374.0
2011-04-01       374.0
2011-07-01       374.0
beer.production.plot()
pred_last.production.plot()
실행 결과
<Axes: xlabel='quarter'>
<Figure size 640x480 with 1 Axes>
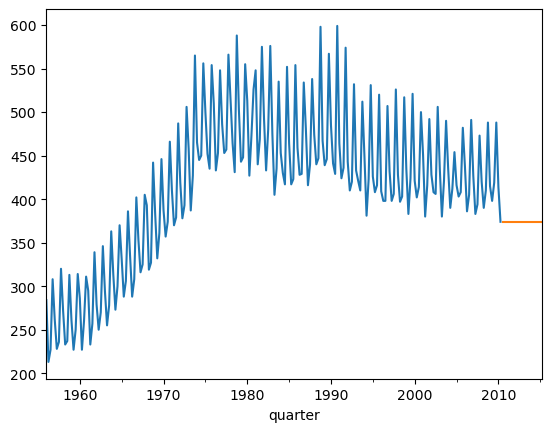
- 마지막 관측값 374를 미래 분기에 반복
평균으로 예측
- 과거 데이터의 평균을 모든 예측값으로 사용
- 기간을 지정하지 않으면 전체 훈련 데이터의 평균 사용
- 이 자료의 전체 평균은 약 415.37이며, 모든 미래 분기에 같은 값으로 예측
fc_mean = NaiveForecaster(strategy='mean')  # 평균 기법
fc_mean.fit(y)
y_pred_mean = fc_mean.predict(fh=future_dates)
pred_mean = pd.DataFrame({'production': y_pred_mean}, index=future_dates)
pred_mean.head()
실행 결과
            production
2010-07-01   415.37156
2010-10-01   415.37156
2011-01-01   415.37156
2011-04-01   415.37156
2011-07-01   415.37156
beer.production.plot()
pred_mean.production.plot()
실행 결과
<Axes: xlabel='quarter'>
<Figure size 640x480 with 1 Axes>
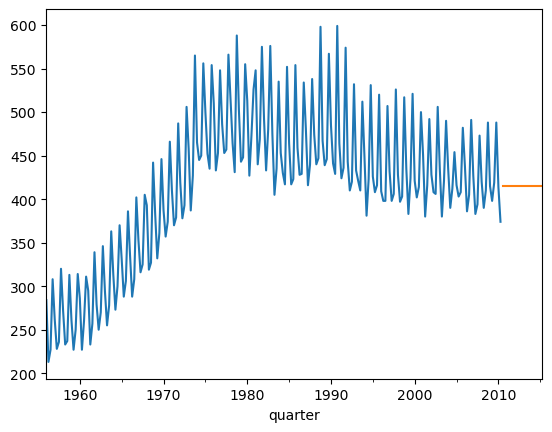
평균 기간의 제한
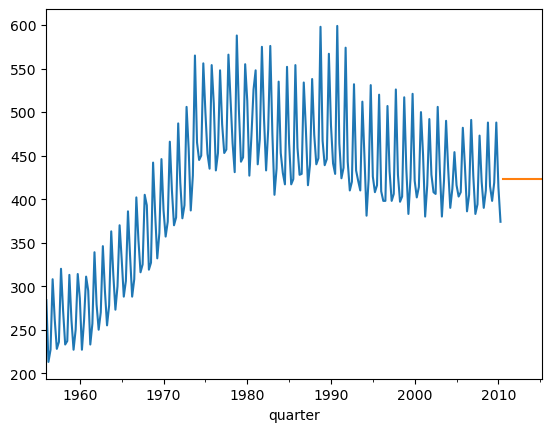
window_length=12: 최근 12개 분기, 즉 3년의 평균만 사용
fc_mean_12 = NaiveForecaster(strategy='mean', window_length=12)  # 최근 3년
fc_mean_12.fit(y)
y_pred_mean_12 = fc_mean_12.predict(fh=future_dates)
pred_mean_12 = pd.DataFrame({'production': y_pred_mean_12}, index=future_dates)
pred_mean_12.head()
실행 결과
            production
2010-07-01  423.583333
2010-10-01  423.583333
2011-01-01  423.583333
2011-04-01  423.583333
2011-07-01  423.583333
beer.production.plot()
pred_mean_12.production.plot()
실행 결과
<Axes: xlabel='quarter'>
<Figure size 640x480 with 1 Axes>
표류로 예측
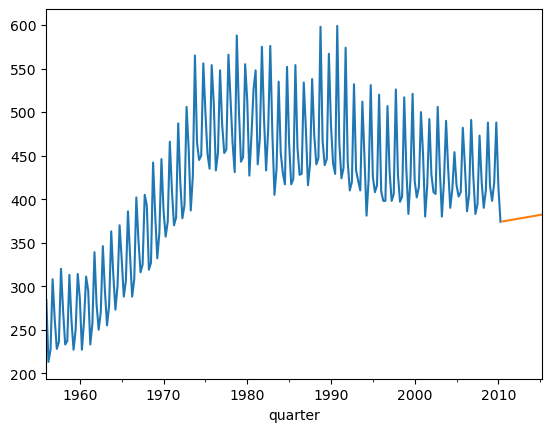
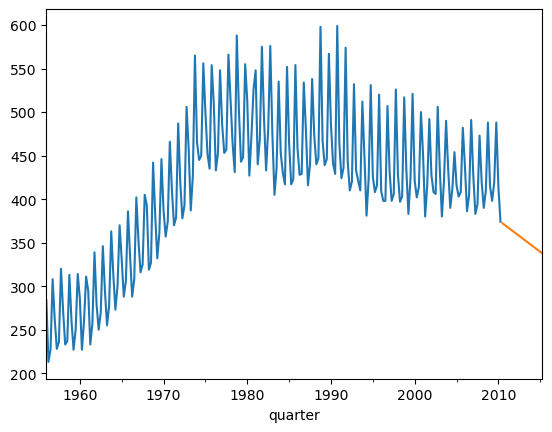
- 표류(drift): 과거의 평균 변화량을 미래에 적용
- 사용하는 구간의 첫 값과 마지막 값을 잇는 직선을 미래로 연장
fc_drift = NaiveForecaster(strategy='drift')
fc_drift.fit(y)
y_pred_drift = fc_drift.predict(fh=future_dates)
pred_drift = pd.DataFrame({'production': y_pred_drift}, index=future_dates)
pred_drift.head()
실행 결과
            production
2010-07-01  374.414747
2010-10-01  374.829493
2011-01-01  375.244240
2011-04-01  375.658986
2011-07-01  376.073733
beer.production.plot()
pred_drift.production.plot()
실행 결과
<Axes: xlabel='quarter'>
<Figure size 640x480 with 1 Axes>
표류 기간의 제한
- 최근 12개 분기의 첫 값과 마지막 값으로 평균 변화량 계산
- 관측값은 12개이며, 그 사이의 변화 구간은 11개
- 전체 기간에서는 분기당 약 0.415 증가, 최근 12개 분기에서는 약 1.818 감소
- 참고하는 과거 구간에 따라 예측 방향도 달라짐
fc_drift_12 = NaiveForecaster(strategy='drift', window_length=12)  # 최근 3년의 변화량
fc_drift_12.fit(y)
y_pred_drift_12 = fc_drift_12.predict(fh=future_dates)
pred_drift_12 = pd.DataFrame({'production': y_pred_drift_12}, index=future_dates)
pred_drift_12.head()
실행 결과
            production
2010-07-01  372.181818
2010-10-01  370.363636
2011-01-01  368.545455
2011-04-01  366.727273
2011-07-01  364.909091
beer.production.plot()
pred_drift_12.production.plot()
실행 결과
<Axes: xlabel='quarter'>
<Figure size 640x480 with 1 Axes>
퀴즈
predict(fh=future_dates)에서 fh의 역할은 무엇인가요?
퀴즈를 풀려면 대화형 기능을 불러와야 합니다.