모델 성능 비교 및 선택 전략
데이터 로딩
- 불량 분류 데이터를 불러오고, 입력 변수
X와 정답 변수y를 분리 defect열은 예측하려는 목표 변수로 사용
import pandas as pd
import warnings
from sklearn.model_selection import train_test_split
from sklearn.pipeline import make_pipeline
from sklearn.preprocessing import StandardScaler
from sklearn.linear_model import LogisticRegression

df_defect = pd.read_csv('defect_classification.csv')

X = df_defect.drop(columns='defect')
y = df_defect['defect']
데이터 분할 및 모델 학습
- 학습 데이터와 테스트 데이터를 8:2로 분할
stratify=y를 사용해 클래스 비율이 학습/테스트 데이터에서 비슷하게 유지되도록 함StandardScaler()와LogisticRegression()을 파이프라인으로 묶어 전처리와 모델 학습을 함께 수행
X_train, X_test, y_train, y_test = train_test_split(
    X, y,
    test_size=0.2,
    random_state=42,
    stratify=y
)

model = make_pipeline(
    StandardScaler(),
    LogisticRegression(max_iter=1000, solver='liblinear')
)

model.fit(X_train, y_train)
y_pred = model.predict(X_test)
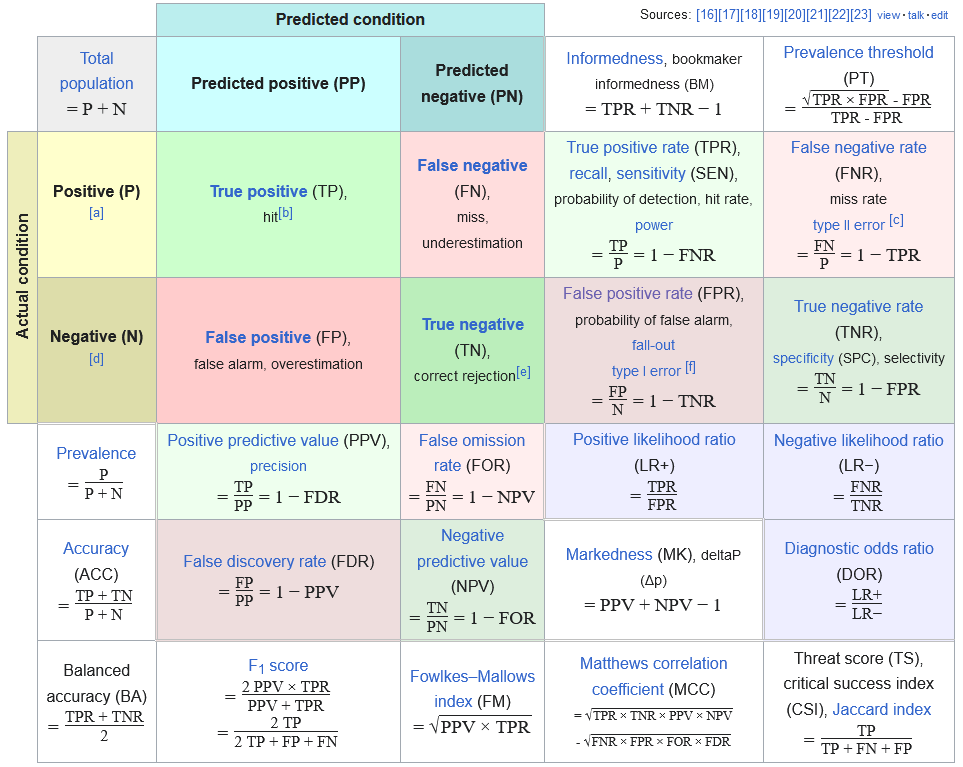
혼동 행렬
- 혼동 행렬(confusion matrix): 실제값과 예측값의 조합을 표로 정리한 분류 성능 요약
sklearn.metrics.confusion_matrix로 계산- 이진 분류에서는 실제 음성/양성과 예측 음성/양성의 조합으로 네 칸이 만들어짐
from sklearn.metrics import confusion_matrix

confusion_matrix(y_test, y_pred)
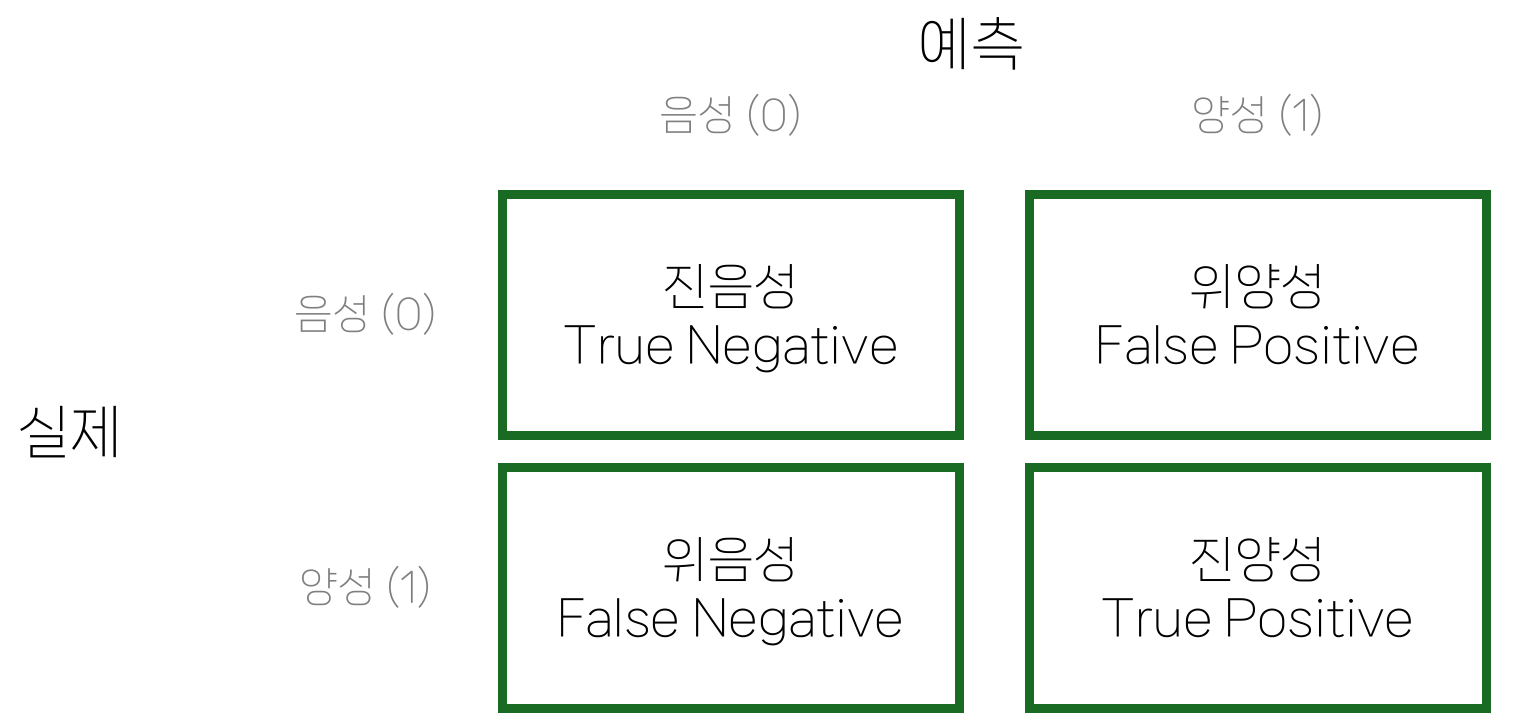
진/위 양성/음성
- 혼동행렬에서 양성/음성은 예측을 기준으로 말함
- 현실에서는 실제로 어떤지 알 수 없는 경우가 많기 때문에 모델 예측이 먼저 관찰되는 경우가 많음
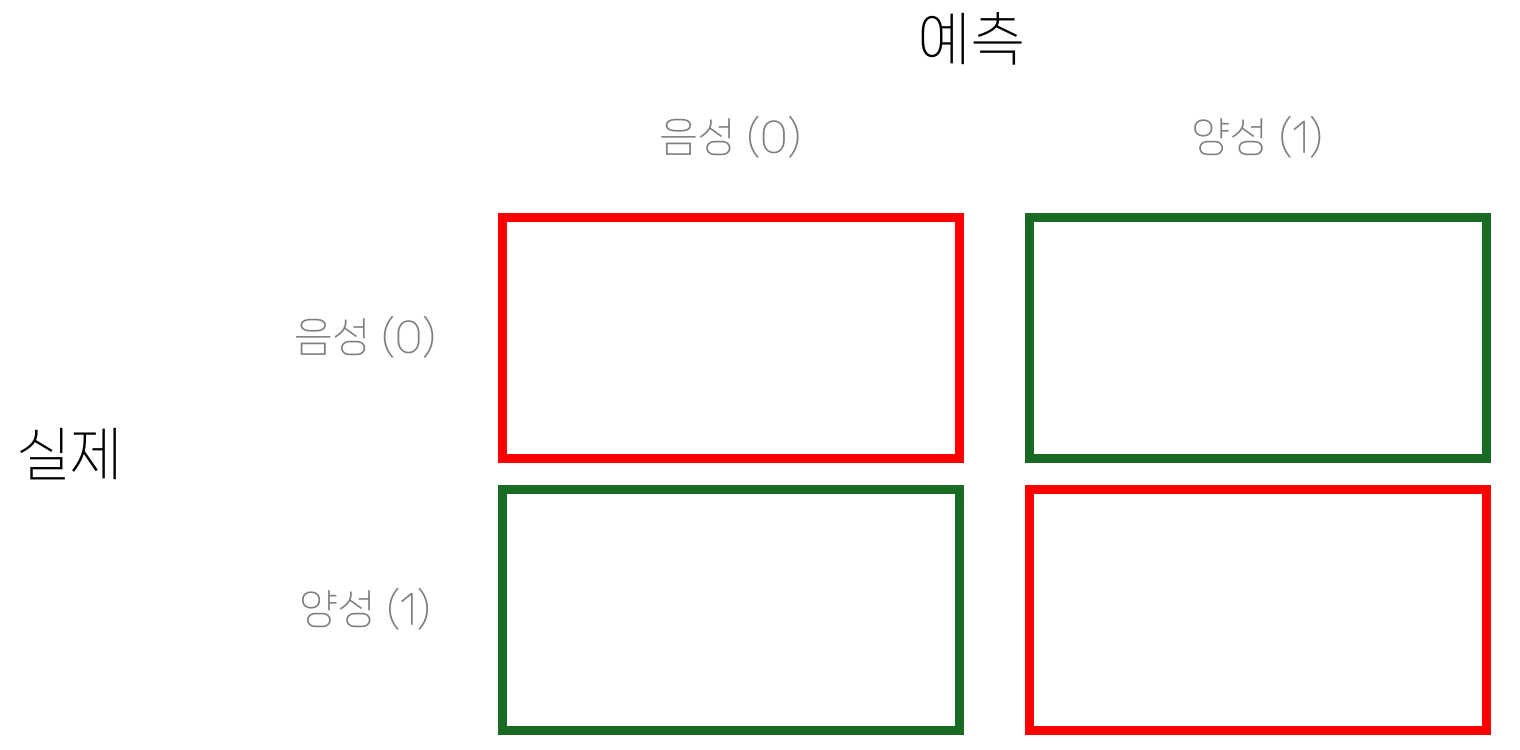
- 진(True): 예측이 맞음
- 위(False): 예측이 틀림
- 주요 용어
- 진음성(TN): 실제 음성, 예측 음성
- 위양성(FP): 실제 음성, 예측 양성
- 위음성(FN): 실제 양성, 예측 음성
- 진양성(TP): 실제 양성, 예측 양성
정확도 accuracy
- 정확도: 전체 중 예측이 맞은 비율
- 음성/양성 구분 자체보다 전체 정답률에 관심이 있을 때 사용
- 그러나 실제 분석에서는 대부분 양성 탐지에 더 관심이 있는 경우가 많음
accuracy_score(y_test, y_pred)
정밀도 precision
- 정밀도: 양성이라고 예측한 것 중 실제로 맞은 비율
- 양성 예측 자체가 중요한 경우 사용
- 예: 채용, 투자, 추천, 결혼 등

precision_score(y_test, y_pred)
재현도 recall
- 재현도: 실제 양성 중 찾아낸 비율
- 양성을 빠뜨리지 않고 찾아내는 것이 중요한 경우 사용
- 예: 방역
- 의학 등에서는 민감도(sensitivity)라고도 하며, TPR(True Positive Rate)와 같음

recall_score(y_test, y_pred)
특이도 specificity
- 특이도: 실제 음성 중 찾아낸 비율
- 음성을 찾아내는 것이 중요한 경우 사용
- 예: 방역
- 대체로 양성 예측을 보수적으로 하면 특이도가 높아짐
- FPR(False Positive Rate): 실제 음성을 양성으로 잘못 예측한 비율
recall_score(y_test, y_pred, pos_label=0)
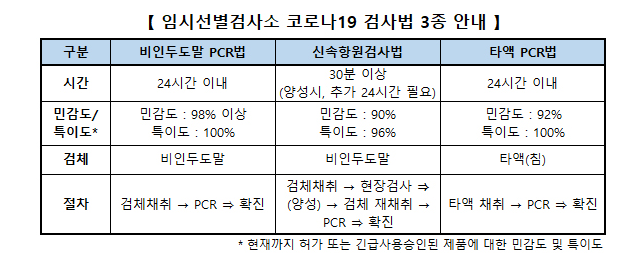
특이도가 낮을 경우 문제점
- 질병 검사에서는 음성이 양성보다 훨씬 많은 경우가 많음
- 특이도가 낮으면 실제 음성이 양성으로 잘못 잡히는 위양성이 많아짐
- 위양성이 많아지면 정밀도가 떨어짐
예를 들어 실제 양성이 1%인 경우를 비교할 수 있음.
| 실제\예측 | 음성 | 양성 |
|---|---|---|
| 음성 | 9900 | 0 |
| 양성 | 2 | 98 |
- 민감도 98%
- 특이도 100%
- 정밀도 100%
| 실제\예측 | 음성 | 양성 |
|---|---|---|
| 음성 | 9504 | 396 |
| 양성 | 10 | 90 |
- 민감도 90%
- 특이도 96%
- 정밀도 18.5%
F1
- F1: 정밀도(
p)와 재현도(r)의 조화 평균 - 조화평균: 역수의 평균의 역수
- 비율, 속도 등을 평균낼 때는 산술평균 대신 조화평균을 사용
f1_score(y_test, y_pred)
평가지표
- 분류 모델의 평가지표는 어떤 오류를 더 중요하게 볼 것인지에 따라 선택
- 정확도는 전체 정답률을 보지만, 클래스 불균형이 크면 모델 성능을 과대평가할 수 있음
- 정밀도는 양성 예측의 신뢰도를, 재현도는 실제 양성 탐지 능력을 강조
- F1은 정밀도와 재현도를 함께 고려해야 할 때 사용